


1. Target definition
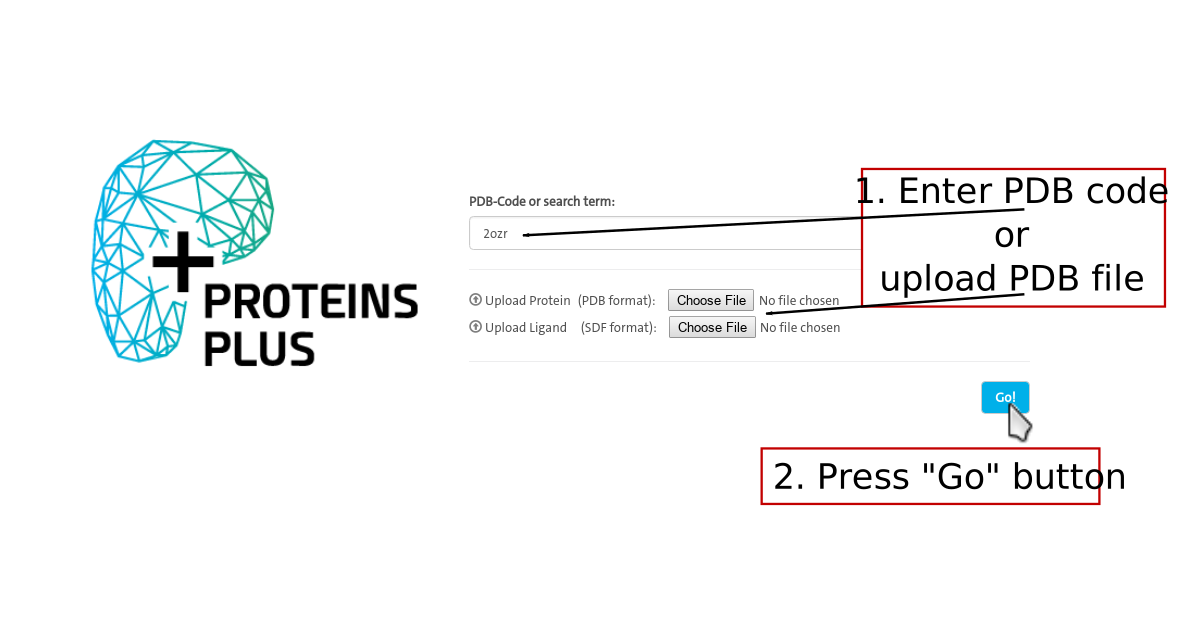
All tools in the ProteinsPlus server work on a structure of a protein or a nucleic acid.
In the first step, you need to define this structure either by selecting a structure form the
Protein Data Bank (PDB) via its PDB code (e.g. 2ozr) or upload any other structure in PDB format.
Additional ligand molecules can be provided in SDF format.
Click on image to jump to that page.
2. Tool selection
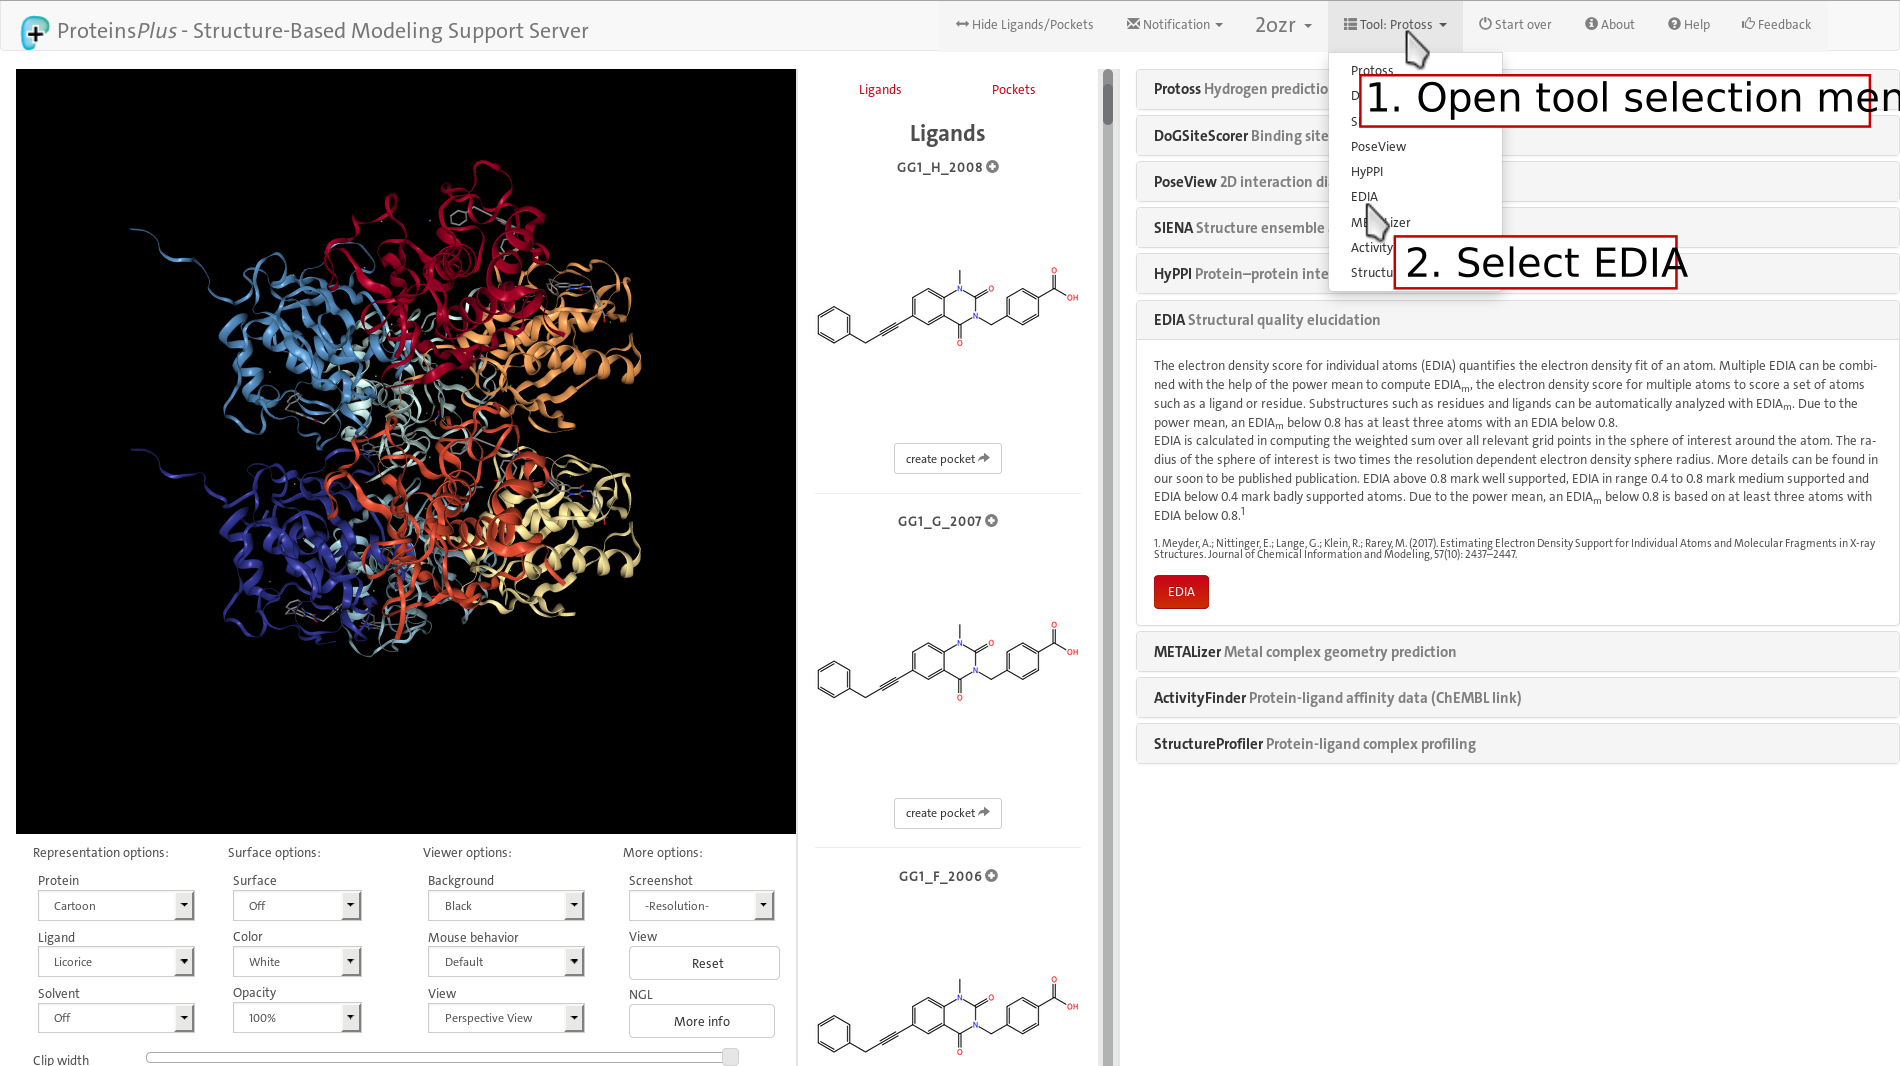
Afterwards you can select the tool you are interested in. You can choose EDIA either by
selecting it from the drop-down menu or by following the link under the respective tool description.
Click on image to jump to that page.
3. Trigger calculation
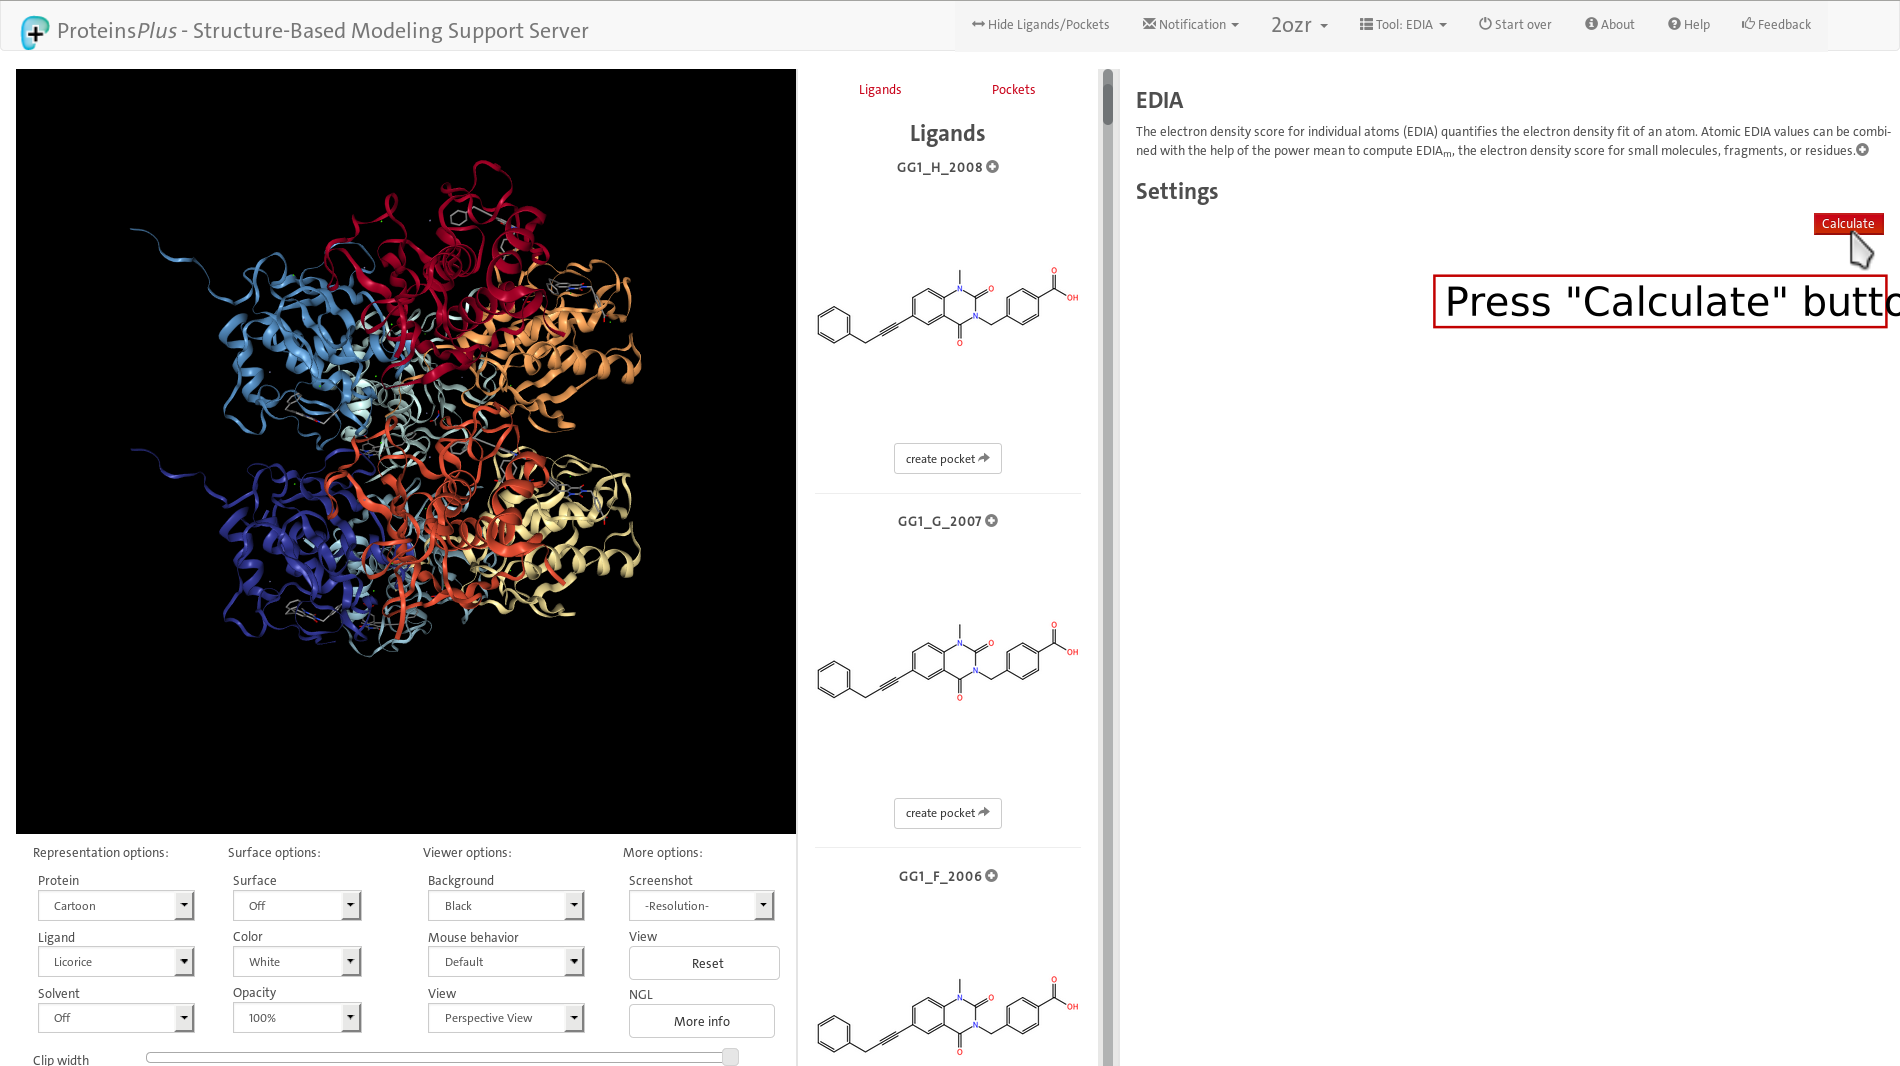
For running EDIA, no configuration is necessary. Just press the calculation button.
Click on image to jump to that page.
4. Result
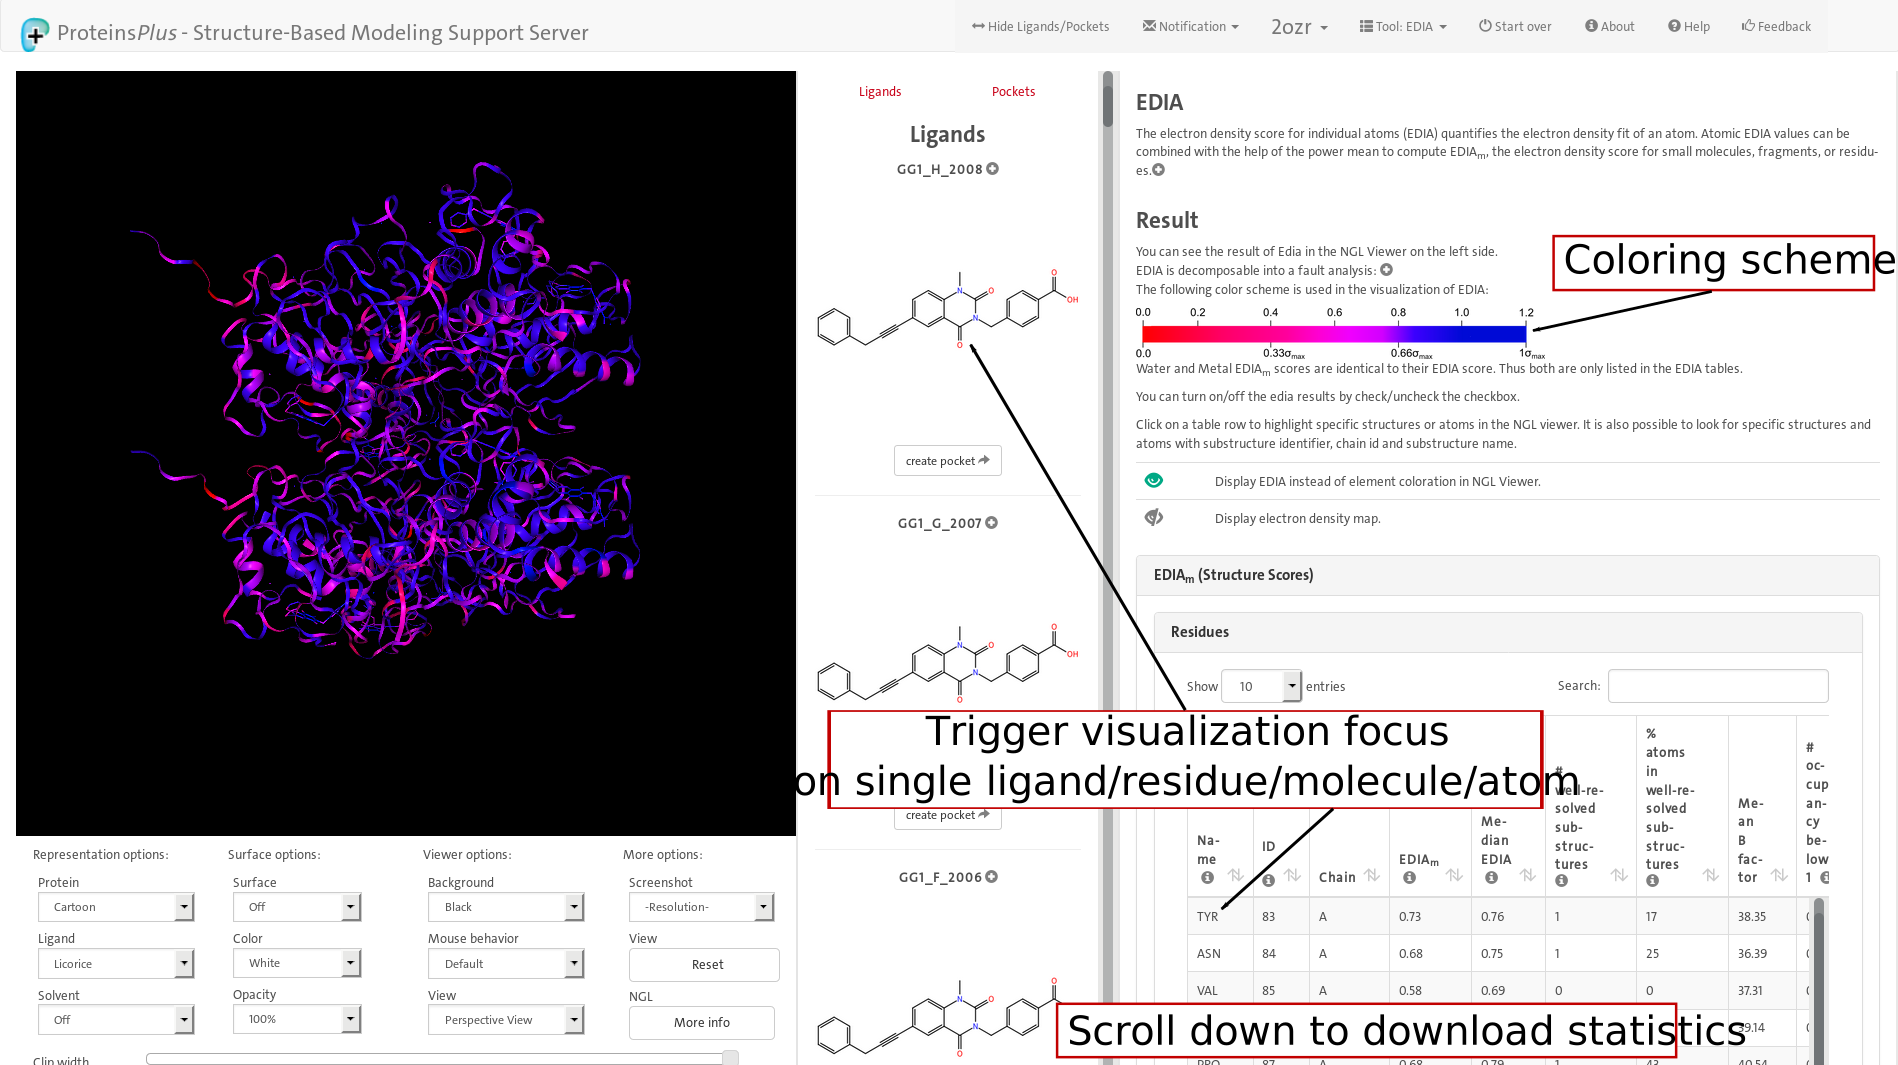
EDIA calculates an individual quality score for each atom, which represents how well this
atoms position is supported by the experimental electron density. These scores are encoded in a coloring scheme,
where blue represents a good and red a poor support. All atoms are accordingly colored in the NGL viewer.
“Display electron density” button can be applied for a visual inspection of the electron density at a level of 1σ.
Further information on medium EDIA values for residue and ligand substructures are given in a result table.
All information can be additionally downloaded using the download button.
Click on image to jump to that page.
Publication
For additional information on EDIA, please refer to the corresponding publications:
Meyder, A.; Nittinger, E.; Lange, G.; Klein, R.; Rarey, M. (2017). Estimating Electron Density Support for Individual Atoms and Molecular Fragments in X-ray Structures. J. Chem. Inf. Model., 57 (10), pp 2437–2447.
Nittinger, E.; Schneider, S.; Lange, G.; Rarey, M. (2015). Evidence of Water Molecules—A Statistical Evaluation of Water Molecules Based on Electron Density. J. Chem. Inf. Model., 55 (4), pp 771–783.